Report 3: 13 – 19 June 2024
This is the third in a series of weekly reports from the Centre for Research in Communication and Culture, Loughborough University on UK wide television and print media reporting of the 2024 UK General Election. These reports will be published weekly throughout the campaign.
Report authors
David Deacon, Jilly Kay, Brendan Lawson, Nathan Ritchie, David Smith, Dominic Wring.
Dr David Smith is Lecturer in Media and Communications, University of Leicester.
Introduction
This is the third in a series of weekly reports from the Centre for Research in Communication and Culture, Loughborough University on UK wide television and print media reporting of the 2024 UK General Election. These reports will be published weekly throughout the campaign.
This report examines:
- The gender distribution of politicians, citizens, and other sources in the reporting of the campaign.
- The visibility and speaking time of political parties and other organizations and individuals involved in the election.
- The most frequently reported campaigners.
- The dominant issues during the formal campaign.
- The positivity and negativity of press reporting of the main parties.
The results in this report are drawn from a detailed content analysis of election coverage produced on the weekdays (i.e. Monday to Friday inclusive) between 30th May and 19th June. The media sampled were:
Television: Channel 4, Channel 5, BBC1, ITV1, and Sky main evening bulletins.
Press: The Guardian, The I, The Daily Telegraph, The Times, The Financial Times, The Daily Mail, The Daily Express, The Mirror, The Sun, The Star.
All election-related news items in the television programmes were analysed. For the press, all election news found on the front page, the first two pages of the domestic news section, the first two pages of any specialist election section and the page containing and facing the papers’ leader editorials were coded.
Read more details on the methodology of the study. Intercoder reliability tests were conducted on all key variables and are ongoing.
Grateful thanks to our coding team: Hannah Bruce, Magnus Hamann, Alistair Kidd, Ella Muncie, Thomas Quinlan, Reuben Shapland, Benji Simpson, Mian Tiao, Roman Winkelhahn, and Caspar Wort.
Executive Summary
'Mansplaining; has dominated the Media Election so far. While male voices have dominated in terms of political party representation, this pattern has also been replicated in the reporting of other voices in campaign reporting.
Men appear far more frequently than women as representatives of businesses, academia, trade unions, think tanks, opinion poll companies, show business, government, and public professions. Crucially women only achieve parity when being featured as 'citizens' or as representatives of media organisations and voluntary organisations.
In issue terms, 2024 is shaping up to be the Taxation Election. Tax has consistently ranked as the top policy issue, receiving double the amount of coverage of the next ranked policy issue. The press has helped ensure this topic has continued to remain prominent during this third week of our sample, reflecting the intense focus on Labour's plans as well as opposition claims relating to the historically high levels of taxation.
The controversy over tax helps explain the extent to which Labour have come under greater negativity press scrutiny than they did last week, although not to the same extent as the Conservatives who continue to attract an even worse press. Levels of negative newspaper evaluations of the party marginally increased over the last week, up on the already high level that followed the controversy over the Prime Minister’s early departure from the D Day commemorations.
The electoral content of newspapers’ frequently categorised as ‘The Tory Press’ show clear differences. Only the Mail and Express provide a ‘positive Conservative/ negative Labour’ approach in their coverage. The Telegraph may be very negative towards Labour, but it also is critical in its reporting of the Conservatives. Although the Sun is negative in its treatment of both parties, its antagonism towards Labour is not as great as that of the Mail, Express, and Telegraph.
In aggregate terms press coverage of Reform, the Lib Dems, and the SNP was marginally more negative in each case during this week of sampling. Taken overall there has been greater press interest in Reform and evaluations of the party have been more polarised than those found for the LibDems and SNP.
The Conservatives and Labour have dominated speaking time in the media campaign so far, accounting for two thirds and four-fifths of all quotation time on TV and in the press respectively. Meanwhile, most of the other parties have only received a substantive hearing on TV, with manifesto launches providing their best speaking opportunities.
The broadcasters have collectively afforded 30% of speaking time to the other parties, compared with only 14% of press speaking time. There is also a broad parity of speaking time among these parties on TV, whereas over three-quarters of other party quotation in the press is provided to Reform UK.
The leaders concerned speak on their parties’ behalf during the vast majority of this time, compared with Starmer and Sunak who contribute around a third of their party’s overall quotation time. Interestingly there is a marked difference between the level of media coverage devoted to the Conservatives compared with their respective standing in public opinion polls, the latter of which indicate some of the other parties are not so far behind them.
Section 1: News presence and news access of political parties
Figure 1.1 compares the news presence of the political parties on TV during the weekday coverage between 30 May to 19 June.
To be coded as ‘present’ a political representative needed to have an active role within the item. They could be counted even if they were not quoted, but there had to be a clear and substantial attribution to them of a speech act or action. Up to five politicians could be coded per item.

Figure 1.1 table
| Party | Leader % | Party % |
|---|---|---|
| Conservatives | 14% | 19% |
| Labour | 13% | 21% |
| Lib Dem | 3% | 4% |
| Reform UK | 7% | 3% |
| Green | 3% | 1% |
| SNP | 3% | 1% |
| Plaid Cymru | 2% | 1% |
| Independents | 1% | |
| Other | 3% |
Figure 1.2 compares the news presence of the political parties in the press during the weekday coverage between 30 May to 19 June.

Figure 1.2 table
| Party | Leader % | Party % |
|---|---|---|
| Conservatives | 15% | 26% |
| Labour | 15% | 28% |
| Lib Dem | 1% | 2% |
| Reform UK | 6% | 3% |
| Green | 0% | 1% |
| SNP | 0% | 1% |
| Plaid Cymru | 0% | 0% |
| Independents | 1% | |
| Other | 0% |
Key findings
- The two main parties have dominated TV and newspaper coverage.
- While balance in terms of presence has varied over weeks, the Labour and Conservative parties have received a similar amount of coverage overall.
- Rishi Sunak and Keir Starmer have featured in a similar amount of coverage and an almost identical amount in terms of press coverage.
- Reform UK are the third most prominent party in terms of both television and newspaper attention. Leader Nigel Farage has crowded out other Reform UK candidates through featuring in over double the amount of coverage compared to the rest of his party. Farage has received a similar amount of attention in both newspapers and broadcasts.
- Ed Davey has attracted some TV coverage but a negligible amount of press attention. Collectively his Liberal Democrat party has received just under half the amount of coverage afforded Reform UK.
- The extent of the focus on Reform UK is illustrated by the party receiving more press coverage than the Lib Dems, the Greens, SNP and Plaid Cymru combined.
- The Greens barely figured in press coverage during this latest week, thereby continuing a trend of limited newspaper attention being paid to the party.
Figures 1.3 and 1.4 compare the news access of the political parties and their leaders through measuring the amount of direct quotation of politicians in coverage (for TV this was measured in seconds, for newspapers this was measured in words).
Figure 1.3 compares news access for political parties and leaders in terms of TV coverage between 30 May and 19 June.

Figure 1.3 table
| Party | Leader (seconds) | Party (seconds) |
|---|---|---|
| Conservatives | 2335 | 4374 |
| Labour | 2256 | 3887 |
| Lib Dem | 999 | 244 |
| Reform UK | 1201 | 179 |
| Green | 899 | 83 |
| SNP | 1265 | 120 |
| Plaid Cymru | 783 | 35 |
| Independents | 209 | |
| Other | 301 |
Figure 1.4 compares news access for political parties and leaders in press coverage between 30 May and 19 June.
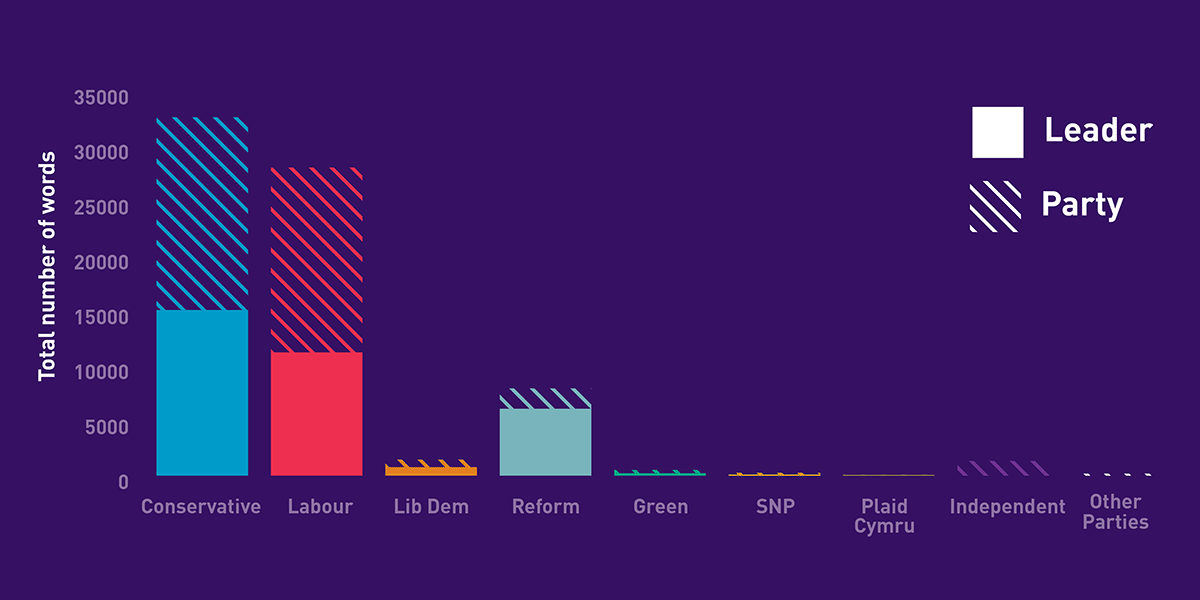
Figure 1.4 table
| Party | Leader (words) | Party (words) |
|---|---|---|
| Conservatives | 15072 | 17554 |
| Labour | 11214 | 16831 |
| Lib Dem | 769 | 686 |
| Reform UK | 6088 | 1854 |
| Green | 213 | 302 |
| SNP | 77 | 175 |
| Plaid Cymru | 49 | 14 |
| Independents | 1335 | |
| Other | 175 |
Key findings
- In overall terms the Conservatives and Labour have – together- had the majority of speaking time during the campaign, with approximately two thirds of all quotation time on TV and over four-fifths of all quotation time in the press.
- The Conservatives have enjoyed slightly more quotation time than Labour, but Rishi Sunak and Keir Starmer’s near equivalent speaking time on TV has not been replicated in the press where Starmer has had only three-quarters the equivalent speaking time devoted to Sunak.
- Broadcast coverage has afforded the other parties a modicum of access in terms of quotation time, particularly around the launch of each party’s manifesto. Around 30% of party speaking time on TV has been afforded to the Lib Dems, Reform UK, Greens and SNP combined; this compares with a mere 14% in the press.
- Much of the other parties’ quotation time on TV has been very leader-dominated with 80% of Lib Dem speaking time afforded to Ed Davey. The equivalent figures for the other leaders are even higher at 87% (Farage/Reform UK), 92% (Denyer and Ramsay/Green), 91% (Swinney/SNP) and 96% (ap Iorwerth/Plaid Cymru). This is in stark contrast to the comparative levels of 35% and 37% for Sunak/Conservatives and Starmer/Labour respectively.
- Other parties and their leaders have received little press attention with the notable exception of Nigel Farage and his Reform UK colleagues. Their newspaper quotation time makes up over three-quarters of the total speaking time devoted to the other parties.
Section 2: most prominent political figures in the media campaign
Table 2.1: Top 20 Individuals
| Position (last week) | Political figure | TV | Press | Total (%s) |
|---|---|---|---|---|
| 1(2) | Keir Starmer (Lab) | 13 | 36 | 30.1 |
| 2(1) | Rishi Sunak (Con) | 16 | 27 | 24.1 |
| 3(3) | Nigel Farage (Ref) | 12 | 12 | 12.1 |
| 4(4) | Rachel Reeves (Lab) | 7 | 9 | 8.2 |
| 5(15) | Wes Streeting (Lab) | 1 | 6 | 5.1 |
| 6(-) | Grant Shapps (Con) | 0 | 6 | 4.4 |
| 7(5) | Jeremy Hunt (Con) | 2 | 4 | 3.5 |
| 8(6) | Ed Davey (LD) | 3 | 3 | 2.6 |
| 9(-) | Lord Cameron (Con) | 1 | 3 | 2.4 |
| 10(-) | Angela Rayner (Lab) | 3 | 2 | 2.1 |
| 11(-) | John Swinney (SNP) | 7 | 0 | 1.9 |
| 12(-) | Boris Johnson (Con) | 1 | 2 | 1.7 |
| 13(-) | Tony Blair (Lab) | 0 | 2 | 1.7 |
| 14(-) | Richard Tice (Ref) | 1 | 2 | 1.6 |
| 15(17) | Claire Coutinho (Con) | 0 | 2 | 1.4 |
| 16(10) | Penny Mordaunt (Con) | 2 | 1 | 1.4 |
| 17(9) | Jonathan Ashworth (Lab) | 1 | 1 | 1.2 |
| 18(-) | Rhun ap Iorweth (Plaid) | 5 | 0 | 1.2 |
| 19(-) | Jeremy Corbyn (Ind) | 1 | 1 | 1.2 |
| 20(-) | Laura Trott (Con) | 1 | 1 | 0.9 |
Notes: percentages = individual’s appearance / total number of items x 100. The figures for TV and press are rounded up/down but the totals are given to decimal point.
Key findings
- Nigel Farage has now consolidated his (third placed) position as the clear alternative voice to the two main contenders for the premiership - Keir Starmer and Rishi Sunak – who are the only politicians to have received greater media coverage.
- Ed Davey retains his position in the Top 10 and is now drawing similar levels of attention from both the broadcasters and the press. Launching the SNP manifesto this week helped John Swinney to secure his highest ranking yet. The appearances by both politicians in the Top 20 reflects (in the absence of any of their colleagues to date) these parties’ decision to focus campaign efforts on their leaders.
- Only two of the Top 10 are women (both Labour- Rachel Reeves and Angela Rayner) while just a quarter of the Top 20 are female politicians, the other three being Conservative Cabinet members Claire Coutinho, Penny Mordaunt and Laura Trott.
- Aside from Chancellor Jeremy Hunt and Shadow Chancellor Rachel Reeves appearing in the top 10, it is noticeable that Grant Shapps and Wes Streeting have emerged as key representatives for their respective parties. The latter’s prominence is also a reflection of the Labour campaign’s focus on health during the week.
- Reform UK’s Richard Tice returns to the list this week following his debut in the Top 10 of the first report. Plaid Cymru leader Rhun ap Iorweth just makes the Top 20 for the first time. The Greens drop out of the rankings following their co-leader’s first appearance last week.
- Three former Prime Ministers (Blair, Cameron and Johnson) make the Top 20 as does Starmer’s predecessor Jeremy Corbyn, now running as an independent against his former party.
Section 3: Gender representation in the media campaign
Figure 3.1 compares the gender differences in election news reporting so far in the campaign, breaking down this distribution by type of news source.

Figure 3.1 table
| Group | Female | Male | Total | Female % | M:F ratio |
|---|---|---|---|---|---|
| Politician | 578 | 2240 | 2818 | 21% | 3.9 |
| Citizen | 150 | 120 | 270 | 56% | 0.8 |
| Think Tank | 38 | 92 | 130 | 29% | 2.4 |
| Business | 20 | 84 | 104 | 19% | 4.2 |
| Media | 40 | 38 | 78 | 51% | 1.0 |
| Public Professional | 15 | 42 | 57 | 26% | 2.8 |
| Government | 3 | 28 | 31 | 10% | 9.3 |
| Trade Union | 9 | 19 | 28 | 32% | 2.1 |
| Pollster | 5 | 26 | 31 | 16% | 5.2 |
| Academic | 9 | 21 | 30 | 30% | 2.3 |
| Voluntary Sector | 12 | 9 | 21 | 57% | 0.8 |
| Celebrity | 3 | 12 | 15 | 20% | 4.0 |
| Quango | 2 | 1 | 3 | 67% | 0.5 |
| Royalty | 0 | 1 | 1 | 0% | |
| Religious | 1 | 0 | 1 | 100% | 0.0 |
| Bookies | 0 | 0 | 0 |
Key findings
- The evidence points to a pattern of ‘media mansplaining’ with women’s voices in election coverage being marginalised across most of the categories identified in Figure 3.1.
- In terms of politicians’ speaking time, women account for less than a fifth of all media quotes by politicians (19 % for women, compared to 81% by men).
- The imbalance in media representations of women politicians accentuates existing gender inequality in political representation (e.g., women made up 35% of all Members of the House of Commons prior to the election).
- The visibility of women politicians dipped this week, with only four women making the Top 20 (see section 2).
- Rachel Reeves is the highest placed woman at number 4, with Angela Rayner at number 10. Conservative female politicians were much less visible, with Claire Coutinho and Penny Mordaunt placing 15th and 16th respectively (see section 2)
- Only one woman of colour appeared in the top 20 this week (Claire Coutinho, Conservative Party)
- Looking beyond the political parties, women are especially underrepresented as spokespeople across multiple categories: for government, academia, business, pollsters, trade unions, think-tanks, and celebrities. The only categories where they are more visible than men are for media, citizens, and voluntary sector categories.
- All the categories in Figure 3.1 are domains where news organisations can exercise considerable editorial discretion as to their selection of news sources.
- Across all sources in election reporting, the proportion of quotations attributed to women was less than one quarter: 23%, compared to 77% for men.
- Women’s lack of visibility in the media reporting of this election compares to similar patterns found for the 2019 campaign.
Section 4: The top issues in the media campaign
Table 4.1: Top issues in TV and Press coverage (13 – 19 June)
Table 4.1 outlines the top 10 issues of the campaign in the third week across TV and press outlets. The issues are ranked by their overall prominence across the week.
| Rank | Issue | TV | Press | Overall |
|---|---|---|---|---|
| 1 | Electoral process | 37% | 39% | 38% |
| 2 | Taxation | 8% | 14% | 13% |
| 3 | Economy/business/trade | 14% | 8% | 10% |
| 4 | Health and NHS provision | 5% | 6% | 6% |
| 5 | Immigration/border controls | 5% | 3% | 4% |
| 6= | Brexit and European Union relations | 1% | 4% | 3% |
| 6= | Standards/corruption/scandals/sleaze | 4% | 3% | 3% |
| 6= | Environment including climate change | 2% | 3% | 3% |
| 9= | Public services | 2% | 2% | 2% |
| 9= | Education | 2% | 2% | 2% |
| Other issues | 20% | 16% | 17% |
Notes: Percentages = (frequency of issue / total number of issues coded) x 100. A maximum of 3 issue responses could be coded per item. To be coded, an issue needed to occupy more than 10 seconds of TV coverage or 2 sentences. The most prominent issues were coded when more than three were present. This table shows the top 10 issue overall for week 3.
Table 4.2: Top issues in TV and Press coverage (30 May – 19 June)
Table 4.2 outlines the top 10 issues of the campaign across our entire sample (30 May – 19 June). The issues are also ranked by their overall prominence.
| Rank | Issue | Overall |
|---|---|---|
| 1 | Electoral process | 37% |
| 2 | Taxation | 12% |
| 3= | Economy/business/trade | 6% |
| 3= | Immigration border controls | 6% |
| 5 | Health and NHS provision | 5% |
| 6 | Standards/corruption/scandals/sleaze | 4% |
| 7= | Minority groups | 3% |
| 7= | Defence/military/security/terrorism | 3% |
| 9= | Environment including climate change | 2% |
| 9= | Education | 2% |
| Other issues | 18% |
Notes: Percentages = (frequency of issue / total number of issues coded) x 100. A maximum of 3 issue responses could be coded per item. To be coded, an issue needed to occupy more than 10 seconds of TV coverage or 2 sentences. The most prominent issues were coded when more than three were present. This table shows the top 10 issue overall for the whole of the campaign.
Key findings
- In terms of substantive policy discussion, this remains the Taxation Election. Since May 30th, the issue of Taxation has received double the coverage (12%) of the second most prominent policy issue of Economy/business/trade (6%).
- The coverage of Taxation in week 3 has been driven by the coverage of Sky’s “The Battle for Number 10” debate and Starmer’s explanation of a "working person”. Whereas in week 1 and week 2, this issue was covered roughly equally by TV and Press, taxation has been far more prominent in press coverage over the last week.
- This is the first week where Brexit and European Union relations has made it in to the top 10. The Labour manifesto launch – and ensuing discussion of their plans for relations with the European Union – has propelled this issue up the agenda. Again, the press has driven the coverage of Brexit in week 3, with TV covering this issue less.
- The Environment has returned to the top 10, after ranking 12th in week 2. As with the issue of Brexit, Labour’s manifesto launch has given this issue more prominence, with their plans to establish Great British Energy and a National Wealth Fund to tackle the climate crisis.
- Overall, coverage of Northern Ireland and Irish unification remains way outside the top 10 issues, only accounting for around 1 in 500 of all themes in TV and Press.
- Electoral process issues continue to dominate coverage. Polling evidence and speculation about the possible scale of a Labour victory have been particularly prominent in the last week.
Section 5: Positive and negative treatment of the political parties in the press
In this section we discuss the overall positivity or negativity of newspaper coverage. For each item we assessed whether the information or commentary contained within it had positive or negative implications for each political party.
This is not just a measure of overt support or criticism by a journalist of a party (although these instances would be included in the count). It is also a measure of the extent to which newspapers report on issues/ comments/ developments that have positive or negative implications for parties. We only coded those instances where these were overtly referred to in the piece.
Scoring
- If an item mainly or solely focused on positive matters for a party, it was given a value of +1.
- If it mainly/ solely focused on negative matters for a party, it was assigned a value of -1.
- Items where there was (a) no clear evaluation, (b) contained positive and negative issues in broadly equal measure or (c) no mention of the party was made, were coded as zero.
- Items where no reference was made to the party were excluded from the calculation.
Figure 5.1
The scores in Figure 5.1 are calculated by subtracting the total number of negative stories from the total of positive stories for the five main parties. The totals are disaggregated by week.
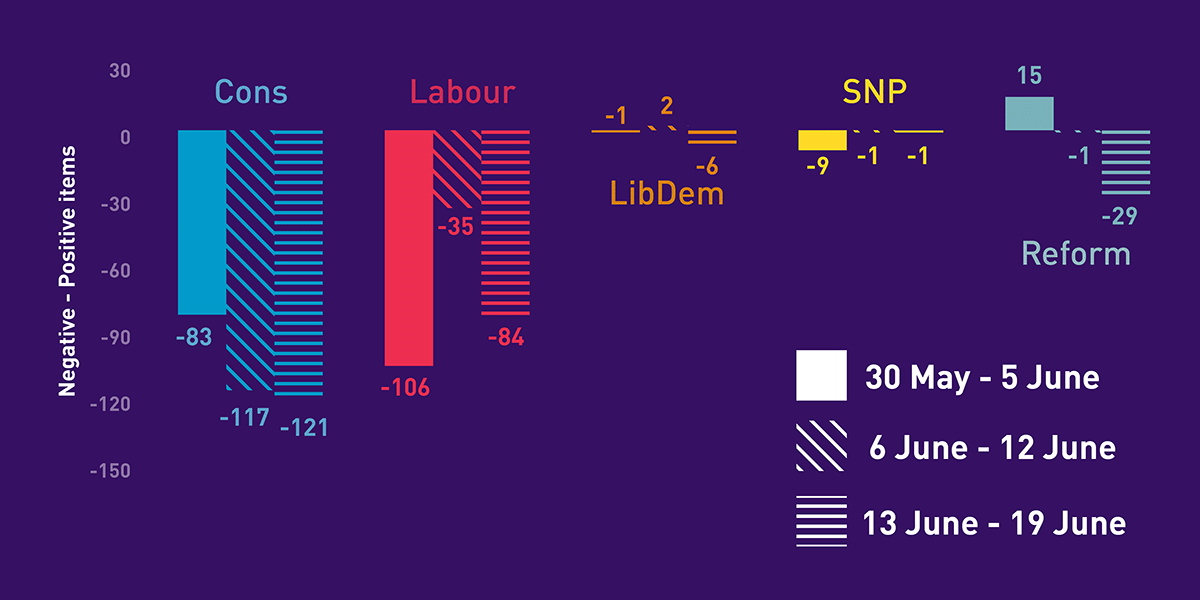
Figure 5.1 table
| Cons | Labour | Lib Dem | SNP | Reform | |
|---|---|---|---|---|---|
| 30 May - 5 June | -83 | -106 | -1 | -9 | 15 |
| 6 June - 12 June | -117 | -35 | 2 | -1 | -1 |
| 13 June - 19 June | -121 | -84 | -6 | -1 | -29 |
Key findings
- There is no sign that newspaper coverage of the Conservatives is becoming less critical. Indeed, news coverage with negative implications for the Conservative party in week 3 even exceeded levels found for week 2 (which had been affected by the furore over Rishi Sunak’s decision to leave the D Day commemorations early).
- Negative press coverage of Labour intensified in week 3 after a significant reduction in week 2. However, levels did not exceed those found in week 1 of our sample.
- Cumulative coverage of Reform became more negative in week 3, in part reflecting media exposés of the past political attitudes and activities of some of the party’s candidates.
- Our weekly evaluations demonstrate that press coverage of the Lib Dems and the SNP also moved into deficit albeit by close margins in both cases.
Figure 5.2
The apparent statistical similarities in the coverage of the three main other parties’ obscure important distinctions.

Figure 5.2 table
| Evaluation | Reform | Lib Dem | SNP |
|---|---|---|---|
| Mainly/ solely positive | 71 | 22 | 13 |
| Mainly/solely negative | 56 | 17 | 2 |
| Mixed negative/ positive | 29 | 10 | 5 |
| No clear evaluation | 144 | 97 | 30 |
Key findings
- With press coverage of Reform, the aggregate figures reflect the polarised pattern of reporting, with comparatively high levels of negative and positive coverage almost cancelling each other out. More than half of the news items that featured Reform displayed some clear evaluative dimension (positive/ negative/ mixed).
- With press coverage of the Lib Dems and SNP, the small fluctuations in evaluations reflect (a) far lower levels of press engagement with their policies and electioneering (see also Figures 1.1 and 1.2), and (b) more descriptive rather than evaluative coverage when it occurs. Nearly two thirds of press reporting of these parties displayed no clear evaluative dimension.
- In summary, Reform appear to be something of a ‘Marmite party’ in media terms – proving palatable and distasteful in nearly equal measure – whereas the Lib Dems and SNP appear more of a ‘vanilla’ option – struggling to stimulate the editorial appetite and taste buds of the national press.
Figure 5.3
Figure 5.3 examines the distribution of main party evaluations by newspaper title.
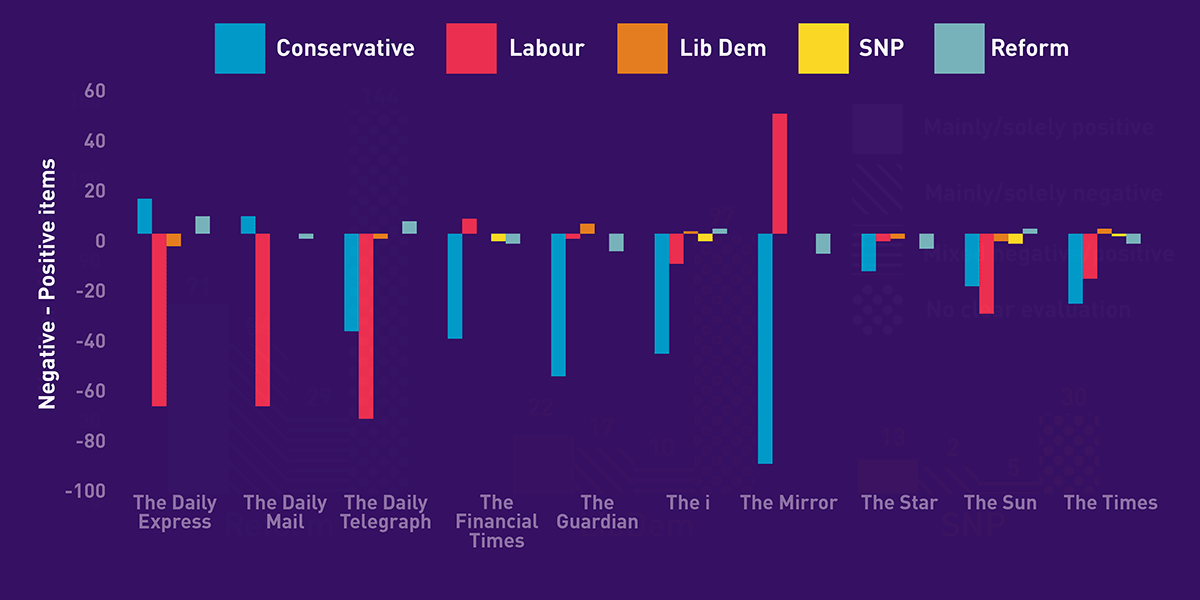
Figure 5.3 table
| Newspaper | Cons | Labour | Lib Dem | SNP | Reform |
|---|---|---|---|---|---|
| The Daily Express | 14 | -69 | -5 | 0 | 7 |
| The Daily Mail | 7 | -69 | 0 | 0 | -2 |
| The Daily Telegraph | -39 | -74 | -2 | 0 | 5 |
| The Financial Times | -42 | 6 | 0 | -3 | -4 |
| The Guardian | -57 | -2 | 4 | 0 | -7 |
| The I | -48 | -12 | 1 | -3 | 2 |
| The Mirror | -92 | 48 | 0 | 0 | -8 |
| The Star | -15 | -3 | -2 | 0 | -6 |
| The Sun | -21 | -32 | -3 | -4 | 2 |
| The Times | -28 | -18 | 2 | -1 | -4 |
| Total | -321 | -225 | -5 | -11 | -15 |
Key findings
- There is a significant variation of editorial responses among newspapers normally categorized as ‘the Tory press’.
- Overall, coverage in the Daily Express and the Daily Mail reveal positive totals for the Conservative Party and very high levels of negativity for the Labour party.
- The negativity of Daily Telegraph reporting of Labour exceeds that of the Express and the Mail, but their coverage also displays significant aggregate negativity towards the Conservatives.
- Particularly remarkable is the editorial pattern found in the The Sun and The Times, both owned by Rupert Murdoch. The Sun’s aggregated coverage show negative ledgers for both main parties with Labour attracting more negativity. In The Times’, negative reporting of the Conservative exceeds that found for the Labour party.
- The Sun, Express, and Telegraph all record marginally positive levels of coverage for Reform.
- The aggregate levels of negativity towards Labour in the Guardian noted in week 1 of our sample has now receded.
- The Financial Times continues to record a mainly positive ledger towards Labour.
- Labour’s loudest newspaper cheer leader is, predictably, the Daily Mirror.