Report 5: 30 May – 3 July 2024
This is the fifth in a series of weekly reports from the Centre for Research in Communication and Culture, Loughborough University on UK wide television and print media reporting of the 2024 UK General Election. These reports were published weekly throughout the campaign.
David Deacon, Jilly Kay, Brendan Lawson, Nathan Ritchie, David Smith, Dominic Wring.
Dr David Smith is Lecturer in Media and Communications, University of Leicester.
Introduction
This report has the following sections:
- The most prominent figures in the media campaign
- The visibility and quotation time of all political parties
- Gender and the 2024 General Election
- Key issues in the media campaign
- Newspaper editorial declarations
- Positive and negative treatment of the political parties in the press
The results in this report are drawn from a detailed content analysis of election coverage produced on the weekdays (i.e. Monday to Friday inclusive) between 30 May and 3 July. The media sampled were:
Television: Channel 4, Channel 5, BBC1, ITV1, and Sky main evening news bulletins.
Press: The Guardian, The I, The Daily Telegraph, The Times, The Financial Times, The Daily Mail, The Daily Express, The Mirror, The Sun, The Star
All election-related news items in the television programmes were analysed. For the press, all election news found on the front page, the first two pages of the domestic news section, the first two pages of any specialist election section and the page containing and facing the papers’ leader editorials were coded. Read more details on the methodology of the study. Intercoder reliability tests were conducted on all key variables and are ongoing.
Grateful thanks to our coding team: Hannah Bruce, Magnus Hamann, Alistair Kidd, Ella Muncie, Thomas Quinlan, Reuben Shapland, Benji Simpson, Mian Tiao, Roman Winkelhahn, and Caspar Wort.
Executive Summary
In terms of substantive policy issues, ‘tax and taxation’ was most prominent in news reporting of the campaign. Immigration, the next most prominent issue, became more marginal as the campaign progressed. Debates about minority rights gained some prominence midway but the ‘culture wars’ didn’t ignite. Brexit was largely ignored. Many topics that the polls consistently indicate to be of public concern - such as the NHS, housing, the environment, social care – received lower levels of media attention. This was a narrow election in policy terms and, by this measure, might be deemed to have been fought within the preferred parameters of the Conservative party.
However, a substantial level of coverage focused on the electoral process itself. Much of this commentary speculated on the likelihood and scale of a Labour victory and much of the remainder reported the spiralling controversy created by assorted several political misjudgements and scandals, most of which implicated the Conservative party. Meta-coverage matters in General Elections and this is where the Conservatives’ campaign encountered grave difficulties. By the end of the campaign discussions about ‘Standards corruption scandals sleaze’ were dominating the media agenda.
In terms of party prominence, the 2024 media campaign was slightly more occupied by the two main parties and slightly less presidential than the previous General Election. Conservatives and Labour sources accounted for 66 % of all political party appearances on the main TV news bulletins and 85 % in the national weekly press (in both cases up 2 % for our equivalent measures of GE2019). Party leaders overall commanded 52 percent of TV appearances (down 7 % from 2019) and 39 % of press appearances (down 3 % from 2019).
The most significant difference in this election was how the remaining scraps of coverage were divided between the other parties. The two-party squeeze is always most evident in national press coverage, but even in TV news, several of the other parties found themselves on thinner rations than before. The Liberal Democrats’ media presence reduced as did the SNP. In contrast, the Reform party gained markedly more media exposure than their predecessor, the Brexit Party. Whereas in GE2019 the Brexit Party accounted for 7% of party appearances on TV and 5 % in the press, these figures respectively increased to 10 % for TV and 9 % for newspapers in 2024.
This was a ‘mansplaining’ media election, with male voices dominating. Comparisons with equivalent figures for the 2019 General Election show some areas where women’s representation has increased but the pattern is uneven and in some areas has regressed. As in 2019, only 1 in 5 of the politicians featured in coverage of the most recent campaign were female. Female journalists have, however, increased their presence, authoring a significantly higher proportion of election news reporting than in 2019.
At the end of the campaign a majority of national newspapers either declared their support for Labour or did not endorse any party. This is a notable realignment compared to the 2019 General Election but our analysis of the wider evaluative trends in coverage shows there was substantial scepticism, negative reporting, and criticism of both main parties across the campaign.
Section 1: most prominent political figures in the media campaign
Table 1.1: Top 20 Individuals (30 May – 3 July)
| Position (last week) | Political figure | TV | Press | Total (%s) |
|---|---|---|---|---|
| 1 | Keir Starmer (Lab) | 21 | 34 | 30.9 |
| 2 | Rishi Sunak (Con) | 22 | 33 | 30.2 |
| 3 | Nigel Farage (Ref) | 10 | 13 | 12.0 |
| 4 | Rachel Reeves (Lab) | 2 | 6 | 4.8 |
| 5 | Ed Davey (LD) | 7 | 3 | 4.2 |
| 6 | Jeremy Hunt (Con) | 1 | 4 | 3.2 |
| 7 | Wes Streeting (Lab) | 1 | 3 | 3.0 |
| 8 | Angela Rayner (Lab) | 3 | 3 | 3.0 |
| 9 | Boris Johnson (Con) | 2 | 3 | 2.4 |
| 10 | Diane Abbott (Lab) | 3 | 2 | 2.4 |
| 11 | Kemi Badenoch (Con) | 0 | 3 | 2.1 |
| 12 | John Swinney (SNP) | 5 | 1 | 1.9 |
| 13 | James Cleverly (Con) | 1 | 2 | 1.9 |
| 14 | Richard Tice (Ref) | 1 | 2 | 1.6 |
| 15 | Grant Shapps (Con) | 1 | 2 | 1.5 |
| 16 | Yvette Cooper (Lab) | 0 | 2 | 1.5 |
| 17 | Jeremy Corbyn (Ind) | 1 | 2 | 1.5 |
| 18 | Bridget Phillipson (Lab) | 0 | 2 | 1.3 |
| 19 | Michael Gove (Con) | 1 | 1 | 1.3 |
| 20 | Lord Cameron (Con) | 1 | 1 | 1.0 |
Notes: percentages = individual’s appearance / total number of items x 100. The figures for TV and press are rounded up/down but the totals are given to decimal point i.e. any 0 above does not indicate the individual in question made zero appearances.
Key findings
- The two major party leaders dominated the election. From week-to-week Keir Starmer and Rishi Sunak also vied with one another to be the more high-profile campaigner. More generally leaders were by far the most prominent representatives of their respective parties’ campaigns, taking front and centre stage throughout the election.
- From the moment he made the sudden announcement he would assume the Reform UK leadership at the beginning of the campaign, Nigel Farage established himself in third place in terms of election coverage. Farage maintained this position throughout the campaign, outdoing rival politicians including other leaders through the press attention he was able to generate.
- Ed Davey attracted enough news interest to take fifth place overall in the media election. In doing so the Liberal Democrat was particularly reliant on television airtime rather than his more modest newspaper appearances.
- Key members of the newly formed government- Rachel Reeves, Wes Streeting and Angela Rayner- all appear in the Top 10 having played significant roles in presenting the Labour case.
- Kemi Badenoch and James Cleverly are the only two potential Conservative leadership contenders in the Top 20 whereas their colleagues who made the list have either ruled themselves out as candidates (Jeremy Hunt), lost their seat (Grant Shapps), or have retired (Michael Gove, David Cameron and Boris Johnson) or are about to resign (Rishi Sunak).
Section 2: The visibility and quotation time of political parties
In this section we look at the wider patterning of party news coverage.
Figure 2.1 compares the aggregated quotation time for the representatives of political parties in TV coverage between 30 May and 3 July.
Figure 2.2 provides the equivalent calculation for direct quotation in the national press.
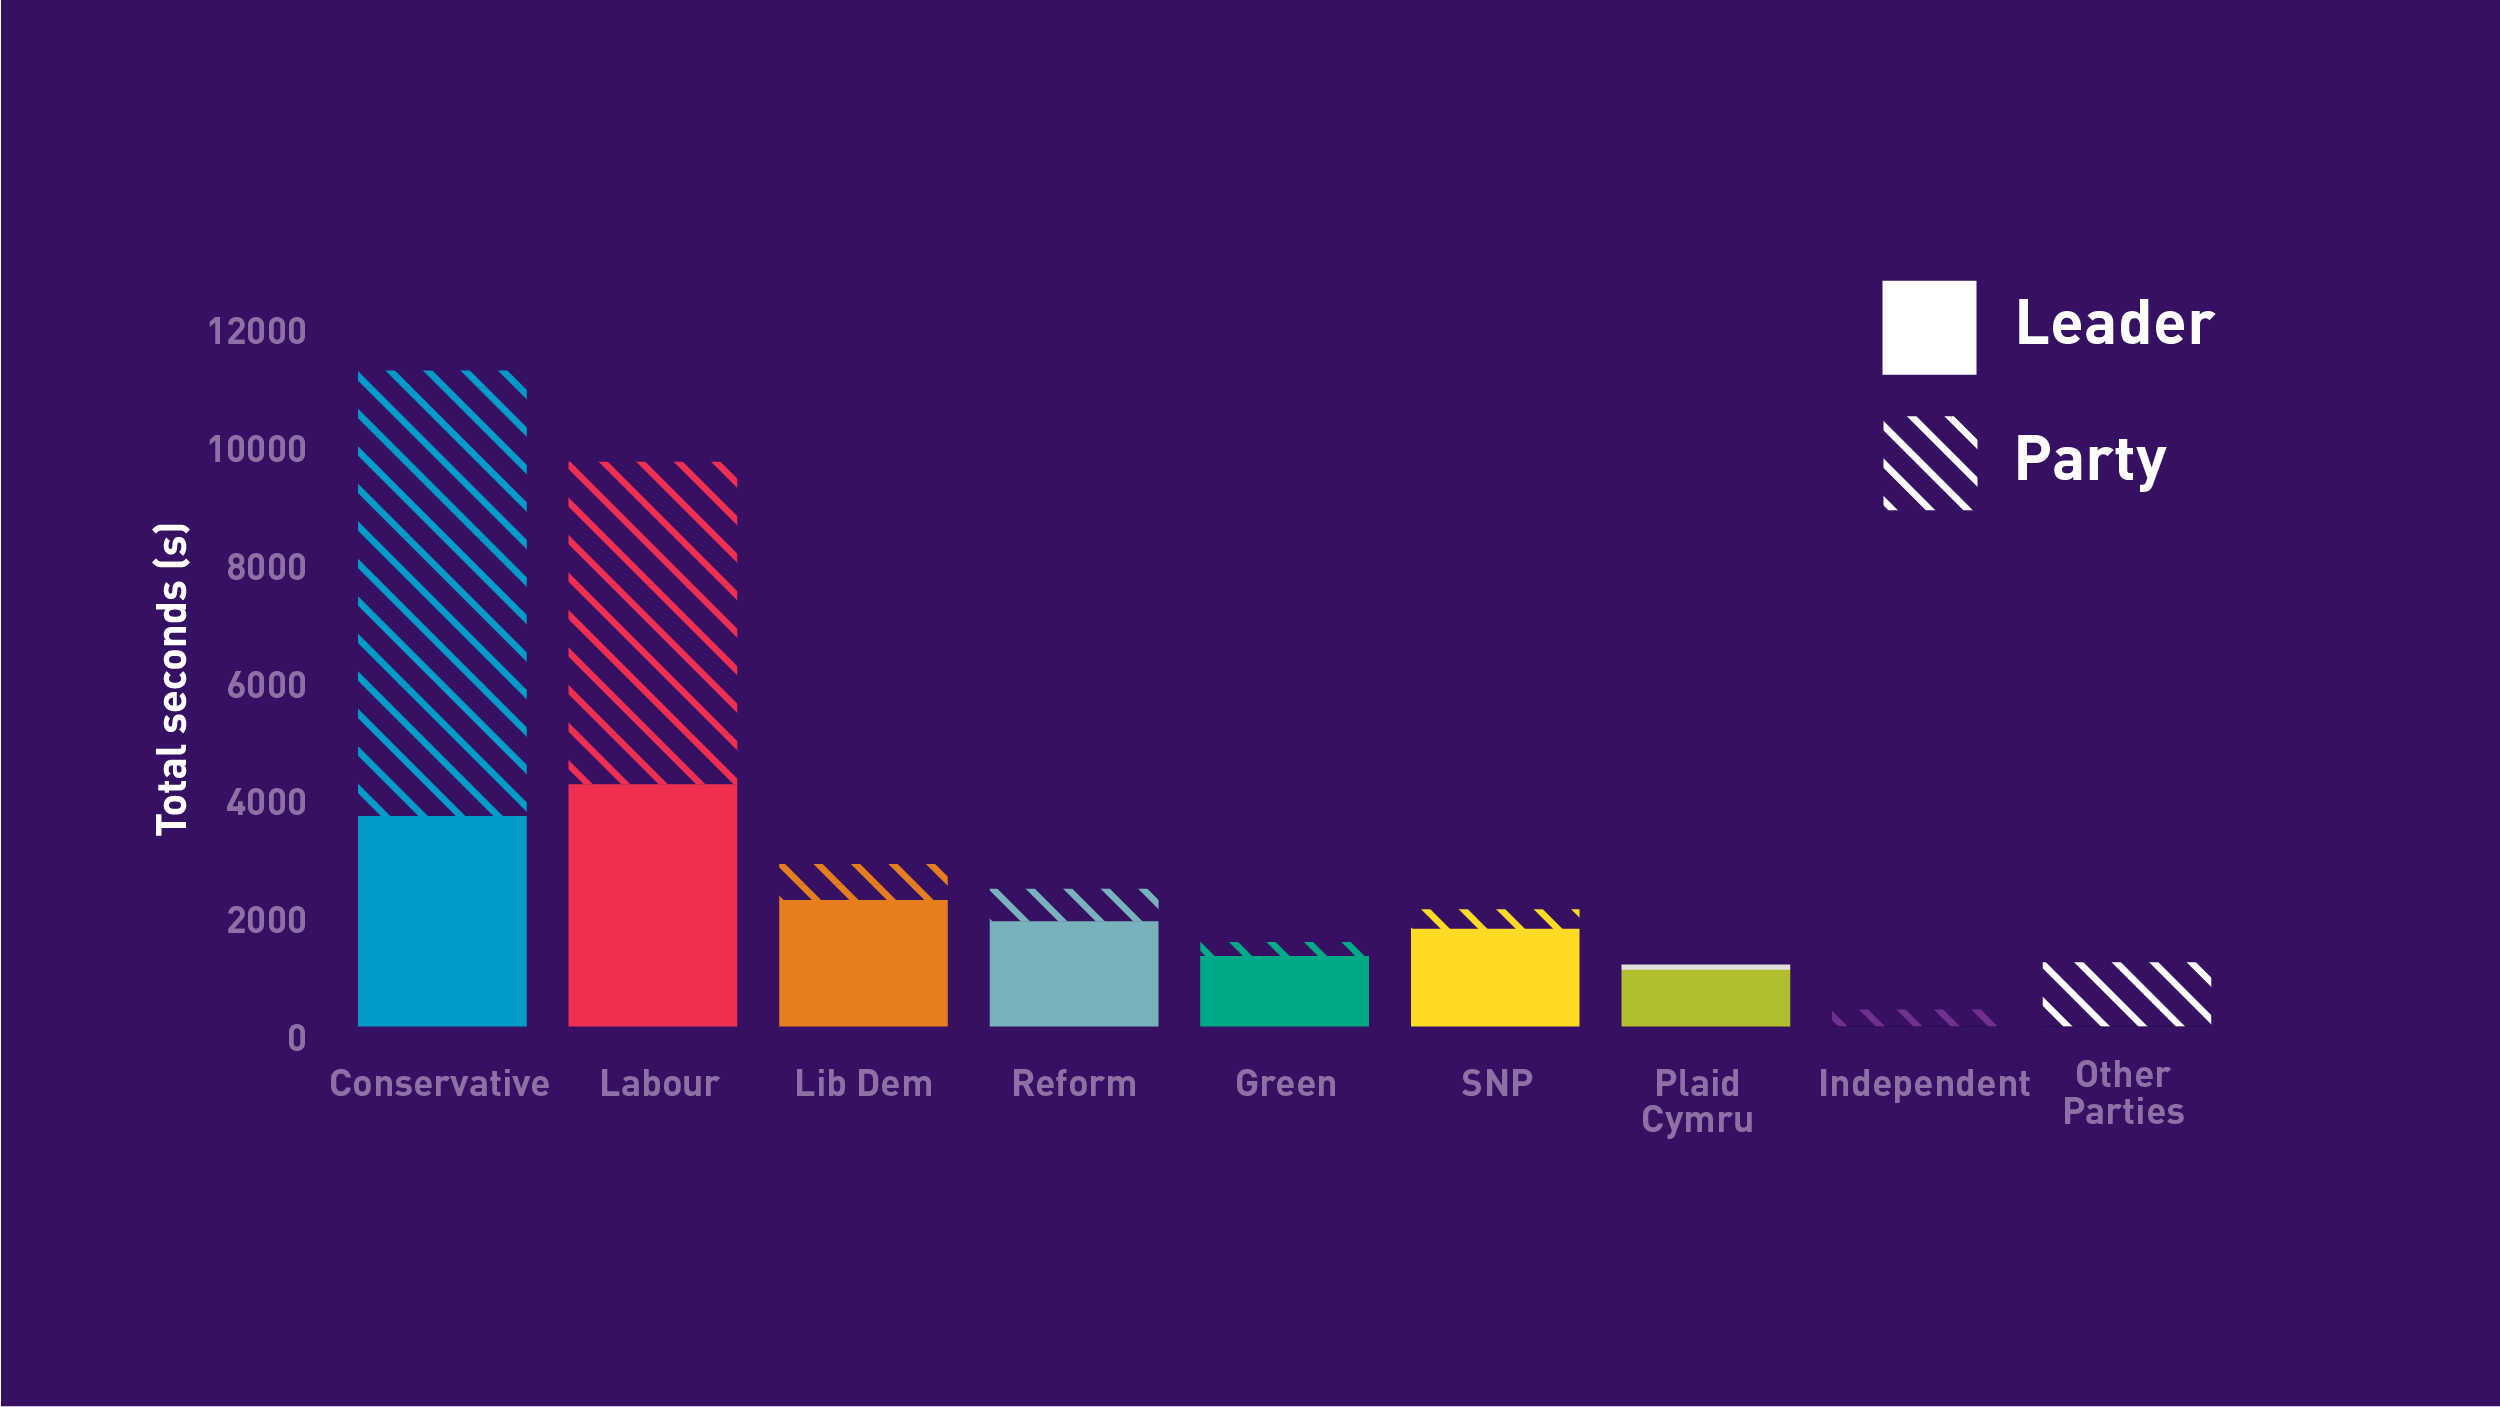
Figure 2.1 table
| Leader | Party | |
|---|---|---|
| Conservatives | 3569 | 7551 |
| Labour | 4106 | 5466 |
| Lib Dem | 2142 | 611 |
| Reform UK | 1783 | 550 |
| Green | 1192 | 237 |
| SNP | 1656 | 331 |
| Plaid Cymru | 962 | 85 |
| Independents | 288 | |
| Other | 1089 |

Figure 2.2 table
| Leader | Party | |
|---|---|---|
| Conservatives | 26625 | 32242 |
| Labour | 23061 | 26902 |
| Lib Dem | 1891 | 1113 |
| Reform UK | 8850 | 3540 |
| Green | 213 | 426 |
| SNP | 222 | 282 |
| Plaid Cymru | 49 | 29 |
| Independents | 2030 | |
| Other | 236 |
Key findings
- Overall, the levels of direct quotation of Conservative politicians exceeded those for Labour in both TV and newspaper coverage.
- The amount of TV direct quotation for the Labour Leader, Keir Starmer, slightly exceed the time allocated to the Prime Minister.
- The Liberal Democrats, Reform UK, and the SNP received comparable levels of quotation time in TV coverage, followed by the Greens and Plaid Cymru.
- The situation was very different with print news coverage, where Reform UK was the only party to attain significant levels of direct quotation.
Politicians and parties are not always directly quoted when they feature in coverage. Table 2.1 compares the frequency with which party sources appeared in coverage in the 2019 and 2024 General Elections.
Table 2.1: News Presence of Political Parties in GE2019 and GE2024
| 2019 | 2024 | |||
|---|---|---|---|---|
| TV | Press | TV | Press | |
| Cons | 30 | 40 | 35 | 43 |
| Labour | 34 | 43 | 31 | 42 |
| Lib Dem | 13 | 6 | 8 | 3 |
| Brexit/Reform | 7 | 5 | 10 | 9 |
| SNP | 7 | 2 | 5 | 1 |
| Green | 3 | 1 | 4 | 1 |
| PC | 1 | 0 | 2 | 0 |
| Other | 4 | 3 | 6 | 2 |
Key findings
- As in 2019, TV news gave more coverage to parties other than Labour and Conservatives than the press. In this campaign, the two main parties accounted for 66 percent of TV appearances compared with 64 percent in GE2019.
- The main changes in TV news reporting occurred in the distribution of coverage among the other parties.
- The Liberal Democrats’ presence of 8 percent of all TV politicians’ news appearances in GE2024 marked a 5 percent reduction from the previous campaign.
- The SNP, too, saw a reduction in their TV news presence, down 2 percent to 5 percent.
- The Green party and Plaid Cymru received small increases in their TV news presence.
- The Reform Party made the most significant gains, attracting 3 percent more appearances than their predecessor, the Brexit Party.
- In Press coverage, the two-party squeeze was even tighter in 2024 than 2019. Eighty five percent of politicians featured in newspaper coverage were from Labour and the Conservatives, 2 percent higher than in GE2019.
- Reform UK dominated the remaining editorial space, accounting for 9 percent of all politician appearances, an increase of 4 percent from GE2019.
Figure 2.3
Figure 2.3: compares the relative prominence of political party leaders in the 2019 and 2024 General Election campaigns.

Figure 2.3 table
2019
| TV (%) | Press (%) | |
|---|---|---|
| Party leaders | 59 | 42 |
| Other Party source | 41 | 58 |
2024
| TV (%) | Press (%) | |
|---|---|---|
| Party leaders | 52 | 39 |
| Other Party source | 48 | 61 |
Key findings
- The 2024 General Election was marginally less ‘presidentialised’ in its coverage than the General Election of 2019.
- The relative prominence of party leaders reduced by 7 percent to 52 percent of appearances in TV coverage of GE2024 compared with the previous election.
- Party leader prominence reduced by a smaller margin in press coverage down by 3 percent to 39 percent in GE2024.
Section 3: Gender and 2024 General Election News Reporting
Figure 3.1
Figure 3.1 shows different categories of news sources included in news reporting of the election. We identified the proportion of people within each category that were female.

Figure 3.1 table
| Category | GE2024 |
|---|---|
| Voluntary Sector | 54.9 |
| Polling | 14 |
| Politicians | 19.2 |
| Media | 45 |
| Academia | 27.9 |
| Celebrities | 47.8 |
| Citizens | 50.3 |
| Business | 17.9 |
| Think Tanks | 32.6 |
| Other Profession | 29.9 |
Key findings
- Female appearances only exceeded male in two categories: ‘voluntary sector’ and ‘citizens’.
- The relatively high figure of female representation in the ‘celebrities’ category is largely due to the high-profile intervention of J K Rowling criticising the Labour party’s policy on gender transition.
- Less than 1 in 5 news sources were women in three categories: ‘politicians’, ‘Business’, and ‘Polling organisations’.
Table 3.1
Table 3.1 provides a comparison with the equivalent analysis we conducted for the 2019 General Election campaign.
| GE2019 (%) | GE2024 (%) | |
|---|---|---|
| Voluntary Sector | 23.9 | 54.9 |
| Polling | 5.9 | 14 |
| Politicians | 19.1 | 19.2 |
| Media | 35 | 45 |
| Academia | 24.4 | 27.9 |
| Celebrities | 22.2 | 47.8 |
| Citizens | 51.2 | 50.3 |
| Business | 34 | 17.9 |
| Think Tanks | 13.3 | 32.6 |
| Other Profession | 34 | 29.9 |
Key findings
- Female representation increased substantially in several of these categories in the 2024 Campaign: ‘Voluntary sector’ up 31 percent; ‘Polling’ up 8 percent; ‘Media’ up 10 percent; ‘Think Tanks’ up 19.3 percent; ‘Celebrities’ up 25.1 percent.
- Other categories have seen more modest increases: ‘Politicians’ up 0.1 percent: ‘Academia’ up 3.5 percent.
- Several categories have seen declines: ‘business’ down 16.1 percent, ‘other professions’ down 4.1 percent.
Figure 3.2
Figure 3.2 compares the proportion of news reports/ features/ interviews authored by female journalists (for those items where it was possible to ascertain gender).

Figure 3.2 table
| GE 2019 | GE 2024 | |
|---|---|---|
| Percentage of all items | 28% | 36% |
Section 4: Key issues in the media campaign
Table 4.1
Table 4.1 ranks the issues reported across newspapers and TV during the last five weeks of the campaign.
| TV | Press | Total | |
|---|---|---|---|
| Electoral process | 36% | 37% | 37% |
| Taxation | 9% | 10% | 10% |
| Standards corruption scandals sleaze | 10% | 6% | 7% |
| Immigration border controls | 5% | 6% | 6% |
| Economy and or business and or trade | 7% | 5% | 6% |
| Health and NHS provision | 4% | 5% | 5% |
| Minority groups | 3% | 5% | 5% |
| Defence military security terrorism | 2% | 3% | 3% |
| Environment including climate change | 3% | 2% | 2% |
| Brexit and European Union relations | 1% | 2% | 2% |
| Crime law and order | 2% | 2% | 2% |
| Education | 1% | 2% | 2% |
| Employment | 1% | 2% | 1% |
| Foreign policy | 1% | 1% | 1% |
| Housing and property issues | 2% | 1% | 1% |
| Social Security | 2% | 1% | 1% |
| Public services | 1% | 1% | 1% |
| Scotland and Scottish independence | 3% | 0% | 1% |
| Energy | 1% | 1% | 1% |
| Culture wars | 0% | 1% | 1% |
| Constitutional legal judicial issues | 0% | 1% | 1% |
| Social care | 2% | 0% | 1% |
| Other issues | 4% | 3% | 3% |
Notes: Percentages = (frequency of issue/total number of issues coded) x 100. A maximum of 3 issue responses could be coded per item. To be coded, an issue needed to occupy more than 10 seconds of TV coverage or 2 sentences. The most prominent issues were coded when more than three were present. Percentages are rounded. A zero may not indicate no appearances.
Key findings
- Coverage of the electoral process (e.g., polls, campaigning activities, strategies etc) was the principal focus of media reporting.
- Several significant political controversies emerged during the campaign, most notable related to the betting allegations against several Conservative party representatives and exposes of the racist opinions of several Reform UK activists. These contributed to making ‘Standards, Corruption, Scandals’ the third most prominent topic in news coverage overall.
- The combination of this category with ‘electoral process’ means that nearly half of all themes coded related to the conduct of, and controversies related to, the campaign rather than substantive policy issues.
- In terms of policy issues, ‘Taxation’ was the most prominent issue overall.
- ‘Immigration/ border controls’ was the next most reported policy issue, followed by ‘Economy/ Business/ Trade’.
- Coverage of ‘minority issues’, in particular debates about gender identities/ ideologies received more than twice the coverage given to ‘Brexit/ European relations’.
- Many topics flagged in opinion polls as of significance to the UK public were sidelined in the media campaign, for example ‘Education’, ‘Environment’, ‘Housing’, and ‘Social Care’.
Figure 4.1
Figure 4.1: tracks how the prominence of the five main election issues changed on a week-by-week basis.

Figure 4.1 table
| 30 May to 5 June | 6 June to 12 June | 13 June to 19 June | 20 June to 26 June | 27 June to 3 July | |
|---|---|---|---|---|---|
| Electoral process | 349 | 322 | 330 | 257 | 336 |
| Taxation | 75 | 150 | 108 | 54 | 33 |
| Standards corruption scandals sleaze | 39 | 42 | 26 | 130 | 71 |
| Immigration border controls | 79 | 42 | 32 | 48 | 42 |
| Economy and or business and or trade | 43 | 41 | 85 | 52 | 19 |
Key findings
- Coverage of ‘taxation’ fluctuated in intensity but it remained the most prominent substantive policy issue for three of the five weeks sampled, and more or less matched ‘immigration’ in week 1.
- ‘Immigration’ was most prominent in the first week of the media sample, largely as a result of Nigel Farage’s surprise announcement that he was standing for Parliament and leading Reform UK into the campaign.
- The betting scandal that engulfed the Conservative party in week 4 increased the prominence of the ‘standards/ corruption’ category. This coincided with a reduction of more general ‘electoral process’ coverage. The combination of these categories in the last two weeks reduced the relative prominence of the substantive policy issues.
Section 5: Newspaper evaluations of the campaign
Table 5.1
Table 5.1 provides the newspaper endorsements published in this election. Critically these also include indications as to the strength of their partisanship.
| Title | 2024 Declaration (2019) | 2024 (2019) | Circulation loss 2019-24 |
|---|---|---|---|
| Daily Mirror | Very Strong Labour (Strong Labour) | 226 (455) | -50% |
| Daily Express | Strong Conservative (Very Strong Conservative) | 140 (298) | -53% |
| Daily Star | Moderate Labour (None) | 127 (289) | -56% |
| The Sun | Weak Labour (Very Strong Conservative) | 700* (1,217) | -45% |
| Daily Mail | Strong Conservative (Very Strong Conservative) | 689 (1,133) | -39% |
| Daily Telegraph | Strong Conservative (Very Strong Conservative) | 190* (309) | -39% |
| The Guardian | Moderate Labour (Weak Labour) | 60* (129) | -53% |
| The Times | None (Strong Conservative) | 180* (365) | -51% |
| The i | None (None) | 125 (220) | -43% |
| Financial Times | Weak Labour (Very Weak Liberal Democrat) | 109 (163) | -33% |
| Totals | Share of endorsements by circulation % (2019) Con 40% (72) Lab 48% (13) LibDem 0% (4) None 12% (11) | 2,546 (4,578) | -44% |
Table 5.1: Daily newspapers’ 2024 editorial declarations with circulations (hard copy in 000s) (with 2019 equivalent partisanships and circulations in brackets).
Source: Audit Bureau of Circulations, May 2024 (November 2019); figures marked * are Press Gazette estimates (NB those titles asterisked no longer submit to the ABC audit). Where a newspaper endorsement has been deemed ‘very strong’ this reflects the one-sided nature of the editorial whereas a ‘strong’ one contains some qualification about the paper’s support for a chosen party. ‘Moderate’ represents a clear stance with some caveats. ‘Weak’ statements are characteristically tentative and highly qualified. ‘Very weak’ endorsements may state a preference but do so in the mildest possible of ways.
Key findings
- Labour won the ‘press campaign’ with five of the ten endorsements representing nearly half of the total print circulation. The Mirror was even stauncher in its support for Labour and more fulsome backing was also forthcoming from the Guardian this time.
- The three other Labour supporting titles included the Financial Times who shifted its allegiance from the Liberal Democrats. For the first time in over twenty years the Star abandoned its editorial neutrality to endorse the winning party. After considerable speculation, the Sun gave belated eve of poll support to Labour.
- The Conservative supporting Express, Mail and Telegraph remained loyal to their party albeit with some qualifications of the kind they had outlined in the preceding campaign.
- The Times abandoned the Conservatives but did not endorse another party, preferring to focus on the shortcomings of Labour. The only other paper, the i, continued to make a virtue of remaining neutral during elections.
Section 6: Positive and negative treatment of the political parties in the press
In this section we discuss the overall positivity or negativity of newspaper coverage. For each item we assessed whether the information or commentary contained within it had positive or negative implications for each political party.
This is not just a measure of overt support or criticism by a journalist of a party (although these instances would be included in the count). It is also a measure of the extent to which newspapers report on issues/ comments/ developments that have positive or negative implications for parties. We only coded those instances where these were overtly referred to in the piece.
Scoring
- If an item mainly or solely focused on positive matters for a party, it was given a value of +1.
- If it mainly/ solely focused on negative matters for a party, it was assigned a value of -1.
- Items where there was (a) no clear evaluation, (b) contained positive and negative issues in broadly equal measure or (c) no mention of the party was made, were coded as zero.
- Items where no reference was made to the party were excluded from the calculation.
The scores in Figure 6.1 are calculated by subtracting the total number of negative stories from the total of positive stories for the five main parties. The totals are disaggregated by week.
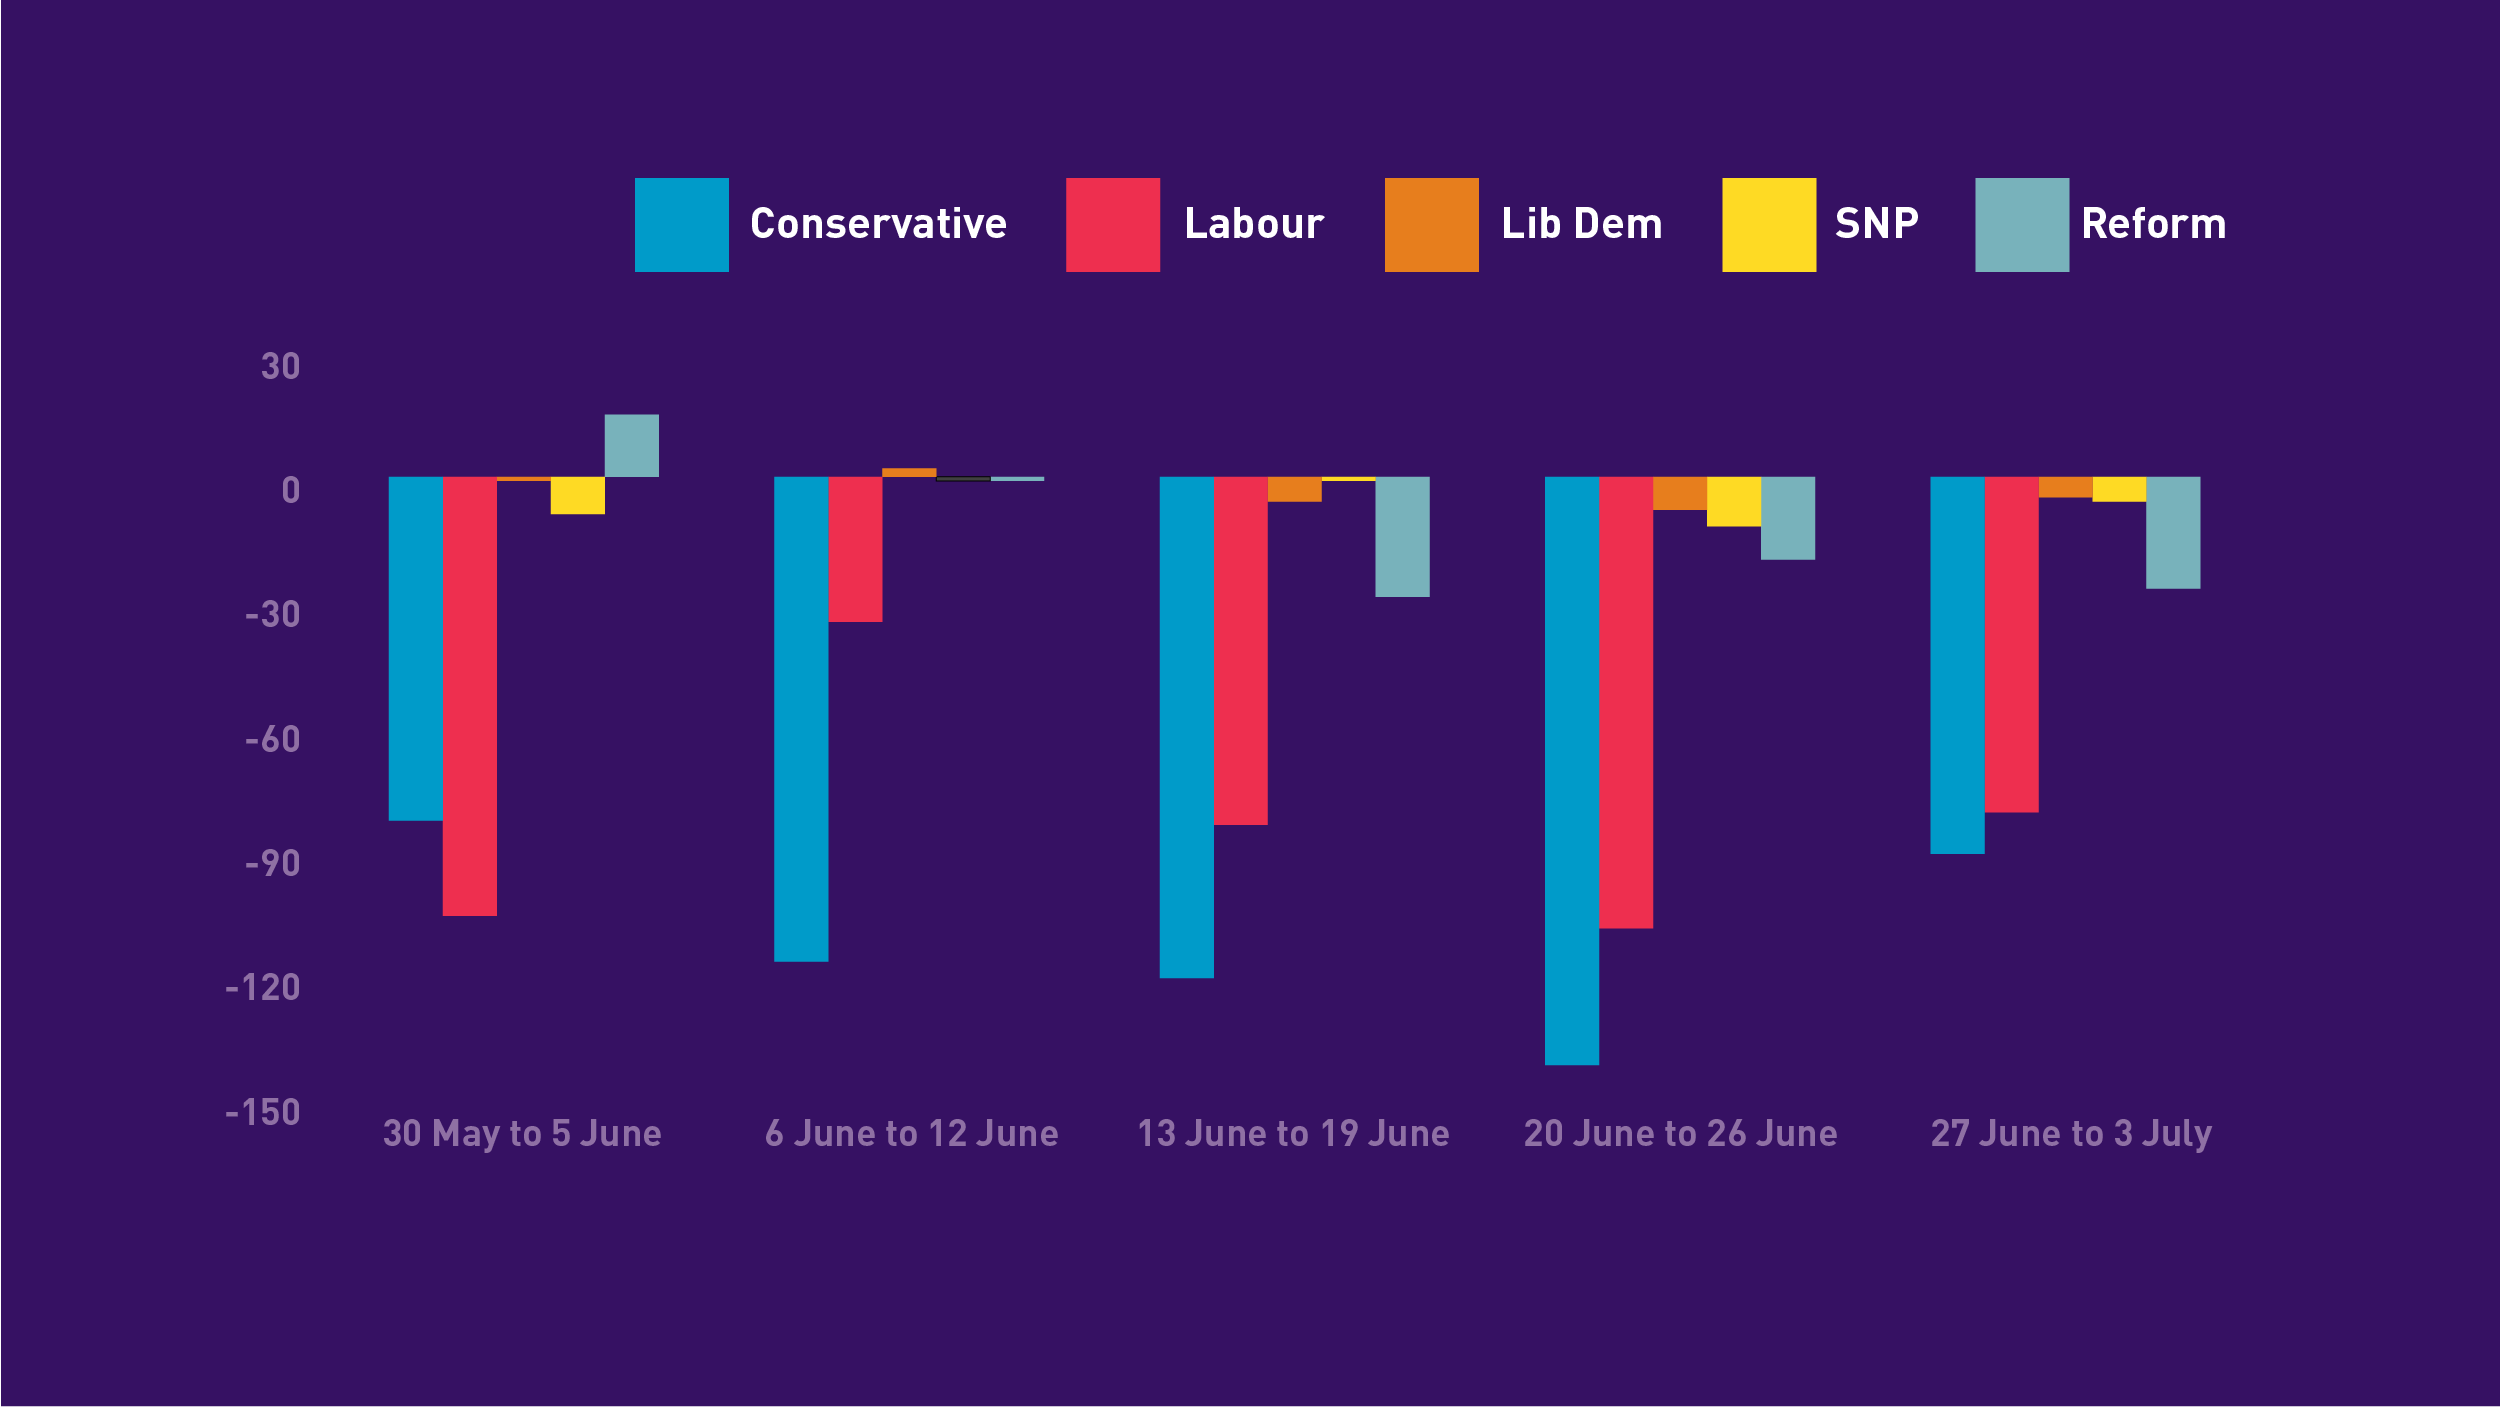
Figure 6.1 table
| Week | Conservatives | Labour | Lib Dems | SNP | Reform |
|---|---|---|---|---|---|
| 30 May to 5 June | -83 | -106 | -1 | -9 | 15 |
| 6 June to 12 June | -117 | -35 | 2 | -1 | -1 |
| 13 June to 19 June | -121 | -84 | -6 | -1 | -29 |
| 20 June to 26 June | -142 | -109 | -8 | -12 | -20 |
| 27 June to 3 July | -91 | -81 | -5 | -6 | -27 |
| Total | -554 | -415 | -18 | -29 | -62 |
Key findings
- The blue bar charts in Figure 6.1 represent the growth of what could plausibly be termed the ‘anti-Tory press’ during this election. Controversies surrounding D Day and gambling ensured press criticisms of the Conservatives persisted throughout the campaign.
- Labour attracted press criticism from the newspapers during this campaign, but this was still noticeably less than the negativity directed at their Conservative rivals.
- Aside from the major two contenders, print media evaluations of the other parties were more limited. Having briefly had a moderately favourable press in the opening week of the campaign, the reporting of Reform UK became more critical as the election drew to a close.

Figure 6.2 table
| Media | Conservatives | Labour | Lib Dems | SNP | Reform |
|---|---|---|---|---|---|
| The Daily Express | 11 | -122 | -10 | -2 | 7 |
| The Daily Mail | 6 | -121 | -4 | 0 | -13 |
| The Daily Telegraph | -57 | -127 | -6 | -4 | -4 |
| The Financial Times | -68 | 3 | 1 | -5 | -2 |
| The Guardian | -97 | -2 | 6 | -2 | -11 |
| The I | -80 | -10 | 1 | -4 | -3 |
| The Mirror | -145 | 64 | -1 | 0 | -16 |
| The Star | -27 | -5 | -2 | 0 | -6 |
| The Sun | -37 | -71 | -4 | -8 | -1 |
| The Times | -60 | -24 | 1 | -4 | -13 |
| Total | -554 | -415 | -18 | -29 | -62 |
Key findings
- Looking at the ten major dailies it is noteworthy that all but two titles (Mail and Express) were critical of the Conservatives.
- Six newspapers (the FT, Guardian, the i, Mirror, Star and The Times) were more negative towards the Conservatives than any of the other rival contenders.
- The nominally loyal Telegraph exhibited some not insignificant criticism of its favoured party.
- Despite endorsing them just before polling day, the Sun was noticeably more hostile towards Labour rather than the Conservatives in the preceding weeks of the campaign.